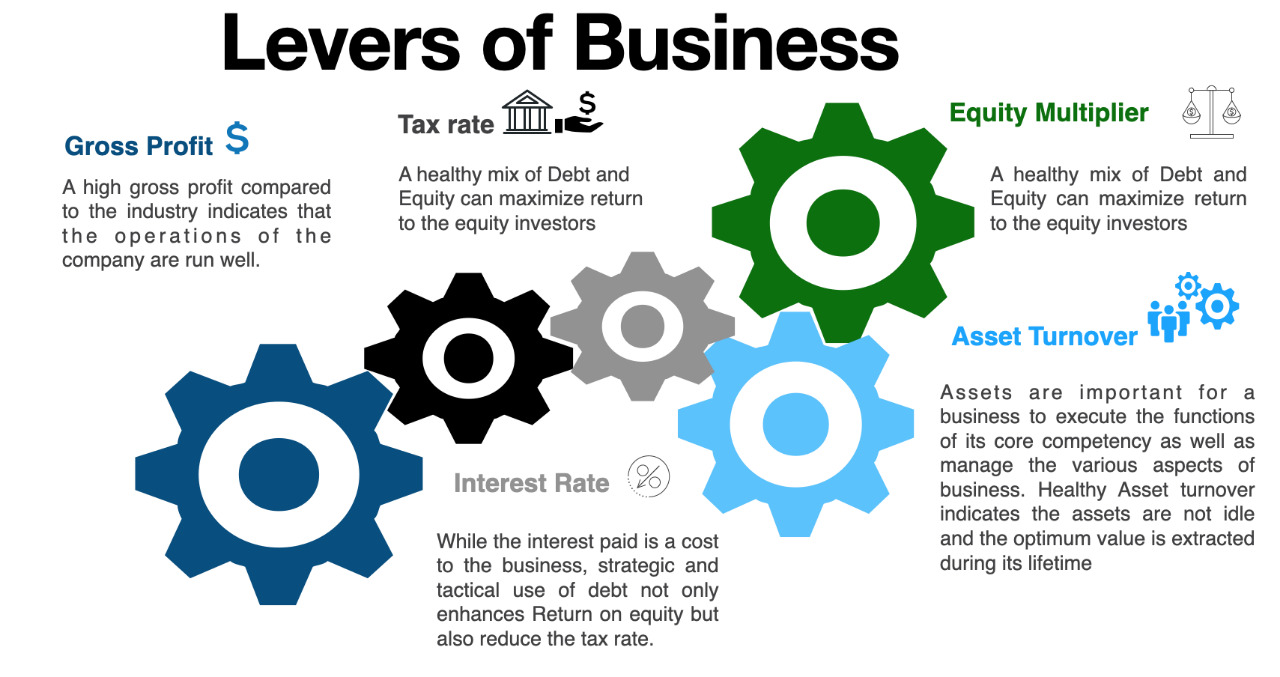
DuPont Analysis to investigate Organisational Efficiency:
Money is invested in a business to generate return on Capital a.k.a Profit. Profit is the net money made after deducting all the costs associated with producing, marketing, selling and financing the product.
Profit ( a.k.a Net Income) = Revenue - Costs incurred
Profit Margin = Net Income / Revenue
Business needs assets to generate a product or provide a service. The asset could be a warehouse, production plant, technical know how, patent, a software or a combination of these. The Revenue generated per unit asset is called asset turnover ratio.
Asset Turnover Ratio = Revenue / Asset
Generally Capital assets are expensive and the expenses are written off over a period of 10 years. Though this is applicable for Return on Asset is the Return generated per unit Asset.
RoA = Net Income / Asset
= (Net Income / Revenue) * (Revenue / Asset)
Funding the Assets:
Companies need to invest money to generate assets. The ratio of Assets to Equity is called Equity multiplier.
Assets = Shareholders Capital or Equity + Debt
The ratio of Debt to Equity is called Leverage
Leverage = Debt / Equity
The ratio of Assets to Equity is called Equity Multiplier.
Equity Multiplier = Assets / Equity
Return on Equity is the ratio of Net income to that of Equity.
RoE = Net Income / Equity
= (Net Income / Revenue) * (Revenue / Asset) * (Asset / Equity)
Tax & Interest:
While a high Equity multiplier might enhance the return on Equity, but also increases the leverage of the Company. Having a healthy leverage helps in reducing the tax rate and enhancing return to shareholders equity. However, an unhealthy leverage might put the company into a debt trap. As a thumb rule the cash-flows of the company should be healthy enough to service the debt repayments.
NI = EBIT - Interest - Tax = PAT
EBT = EBIT - Interest
EBT /EBIT = 1- (Interest /EBIT) = 1- interest rate
PAT = EBT - Tax
(PAT /EBT) = (1 - (Tax/EBT)) = 1- Tax rate
NI / EBIT = (PAT / EBT ) * (EBT / EBIT)
RoE = Net Income / Equity
= (Net Income / Revenue) * (Revenue / Asset) * (Asset / Equity)
= (PAT / EBT ) * (EBT / EBIT) * (EBIT / Revenue) * (Revenue / Asset) * (Asset / Equity)
= (EBIT / Revenue) * (1- Interest rate) * (1- Tax rate) * (Revenue / Asset) * (Asset / Equity)
= (Gross Profit ) * (1- I) * (1-T) * (Asset Multiplier) * (Equity Multiplier)
Limitations of DuPont Analysis
Any framework has to be applied with a context. Despite its many advantages and applications, the DuPont analysis has its limitations such as:
- DuPont analysis relies heavily on the data from a company's financial statements, some of which can be easily manipulated by companies.
- Non-standard accounting practices and methods, auditors' judgement while grouping makes comparisons difficult.
- Performance of some companies is cyclical and depends on Seasonal factors which can severely affect the accounting ratios.
- Judging the company's accounting ratios requires strategic insight into the business.
Conclusion :
The DuPont analysis breaks the final outcome which is profit into various business performance indicators. Assessing the holistic organisational performance and silo performances of various functions helps understand the company's strengths and weaknesses. By deconstructing the profit, it helps business owners and investors understand the smaller components, which helps them adjust the levers to perform optimally to drive the profit and overall efficiency higher by taking informed decisions.
Like, any other framework has to be applied with a context. Despite its many advantages and applications, the DuPont analysis has its limitations. Judging the company's accounting ratios requires strategic insight into the business.


